Demonstrations
Demonstrations
Video walkthroughs of the tools and verification process behind our published results — for readers who'd rather watch the analysis run than read the raw SQL.
The tools shown below trace back to the system built during this project's earliest phase — the one used to watch the data closely enough, through Technical Report v1.4, to first find the closed-form derivation that grounds everything published since. That early system has since needed substantial correction itself (see the Correction Trail on Publications). We're showing it here anyway, because it's the base everything else was built on — flaws and all. New discoveries — including in the DB pipeline itself — have kept coming since, and tool development continues alongside the research, not as a closed chapter.
Every video below shows block-level data derived from the same source images described on Technology — the NIH ChestX-ray8 dataset (Wang et al., 2017).
Both tools run entirely in a browser. The videos also briefly show the Chrome DevTools console, to make clear this is a real, live application rather than a fabricated recording.
3D block viewer

A 3D diagnostic view of the same block-level data, using an egg-shaped model (Shell / Membrane / Yolk). Where a typical approach would compress the data down to 2D or 3D (e.g. via PCA), this system deliberately doesn't: roughly 16–20 dimensions of failure-related information are each mapped directly onto their own independent visual channel (color, surface texture, vibration, direction, and more) — global/local phase, reactivity, and which internal component is driving a collapse, shown simultaneously instead of flattened into a single chart. Documented in full in DOI 1.5.
2D heatmap viewer

A tool for browsing that block-level data interactively instead of writing a SQL query every time: pick an image, see a heatmap of exactly which blocks the metric broke down on, filter blocks by any condition, and pull up statistics across the whole database — all from a web browser. Three tabs: a raw data browser with SQL WHERE-clause filtering, a statistics panel (histograms, distributions, cross-tabulations, CSV export), and the heatmap itself. Documented in full in DOI 1.5.
Pipeline tooling
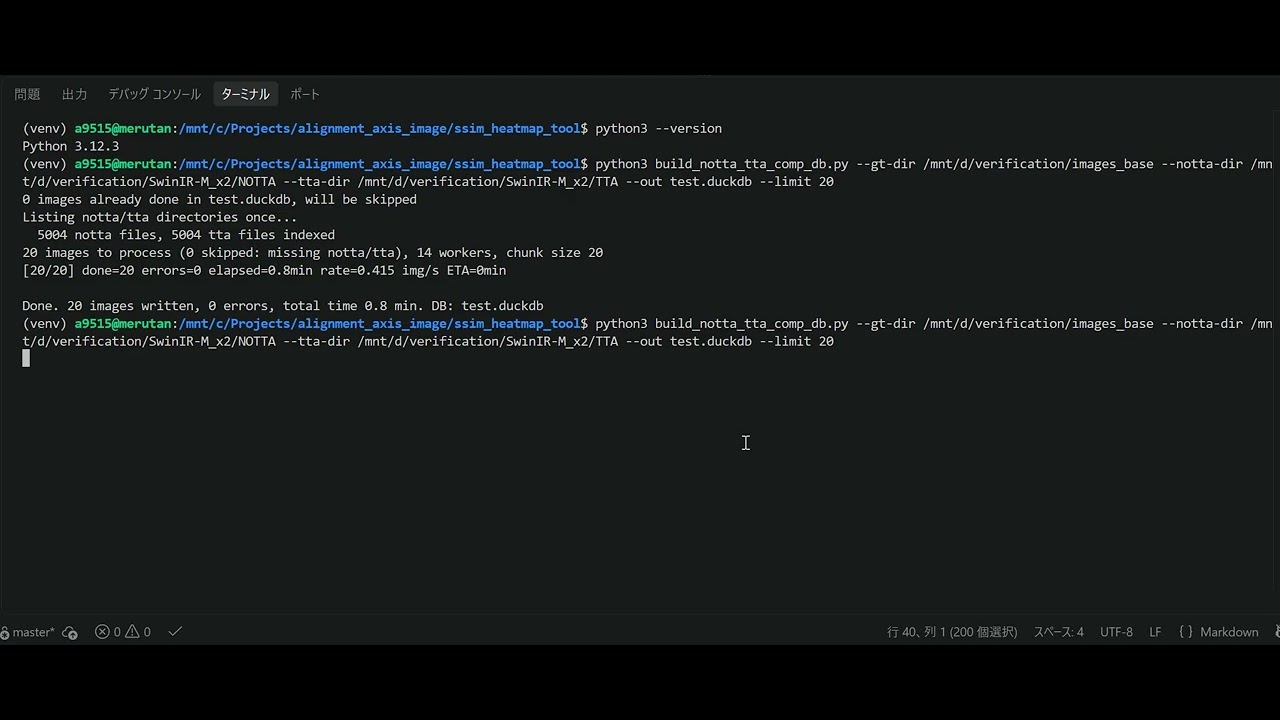
Not a verification of a specific claim, but the tooling itself — the database-building pipeline that produced every database queried in the SQL verification videos below, released as its own report so anyone can build the same kind of database from their own image data.
-
DOI 1.21 New DB
Database-Building Pipeline in Action (Extended Schema)
A live, unedited recording of
build_notta_tta_sigma_db.py— a variant of the established pipeline extended to also store raw sigma_notta/mu_notta values — run twice in a row to demonstrate resumability. -
DOI 1.19.1 New DB
Database-Building Pipeline in Action
A live, unedited recording of
build_notta_tta_comp_db.py— the exact pipeline that generated every number published in Technical Reports v1.12 through v1.16 — run twice in a row to demonstrate that it safely resumes from where it left off.

SQL verification, live
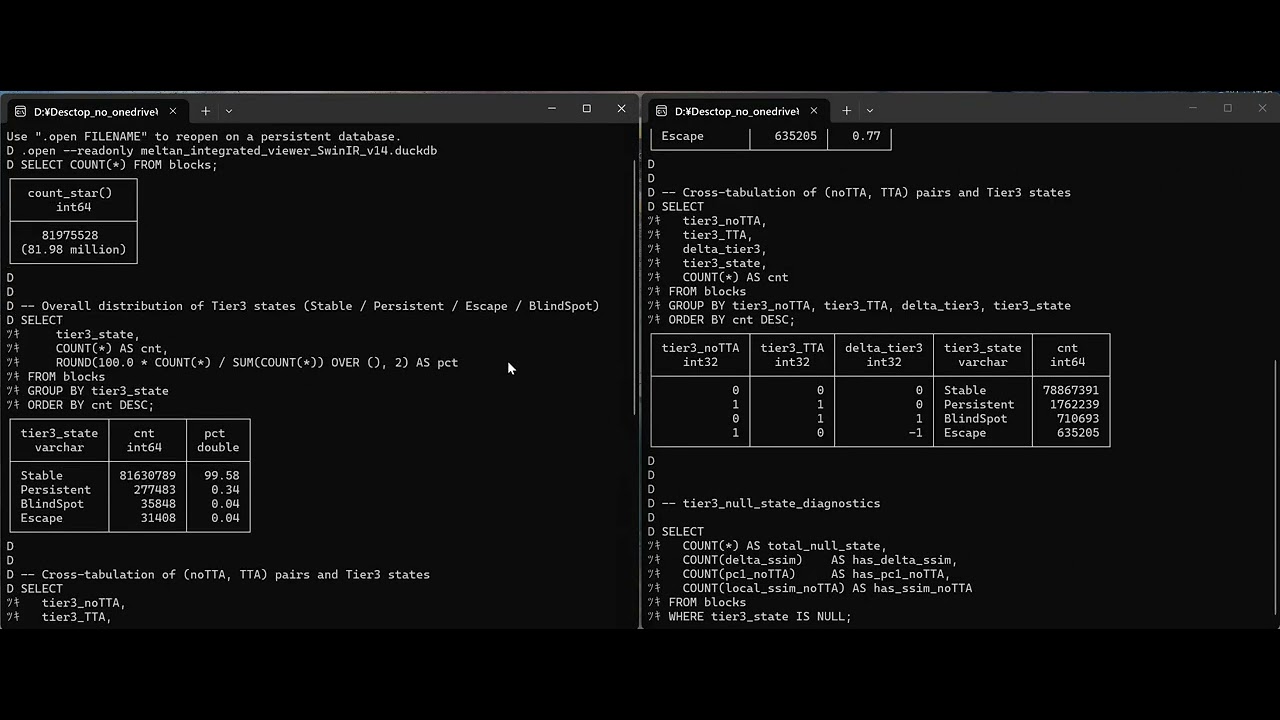
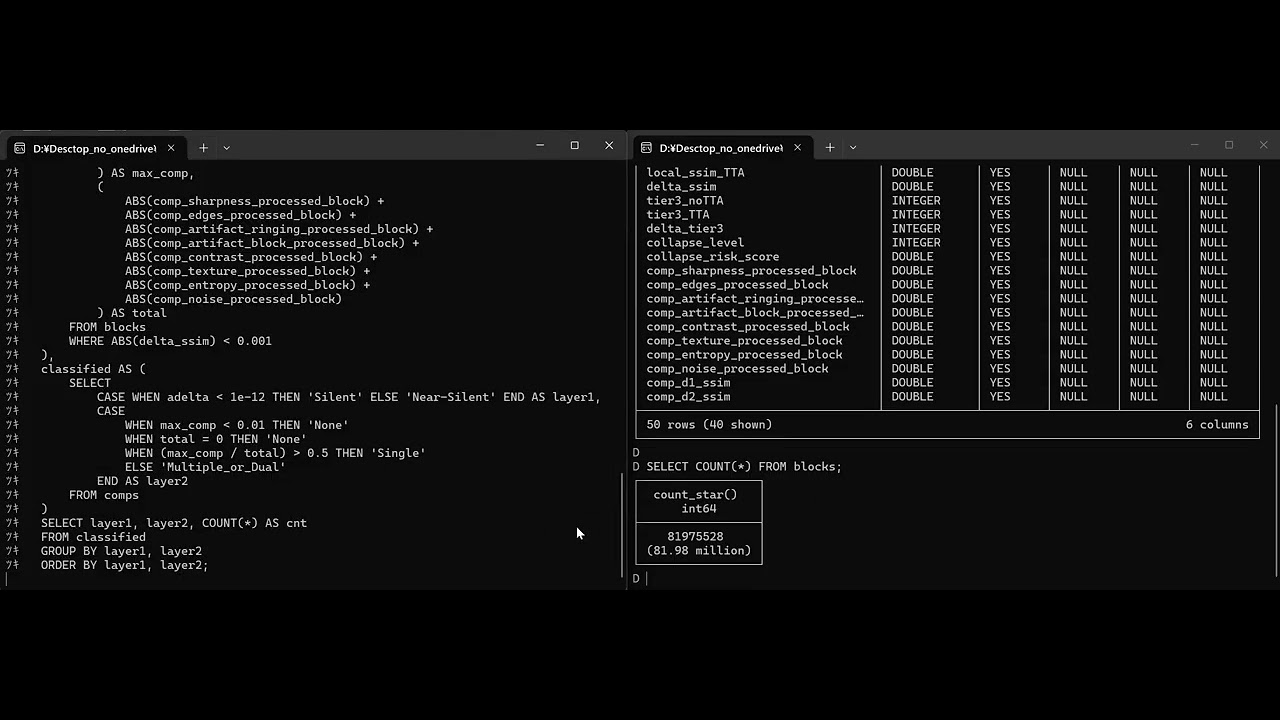
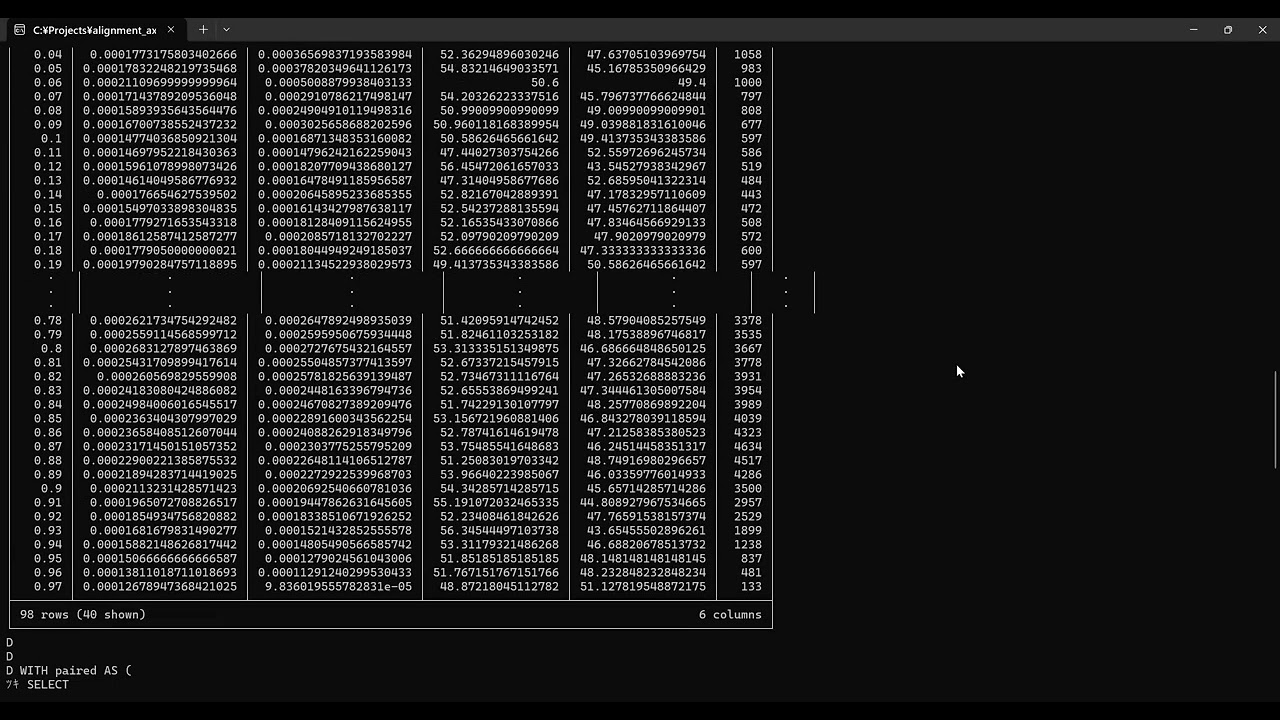
Read-only SQL verification queries executed live against published datasets, each in a single continuous recording — no cuts, no editing — with file hashes recorded in the corresponding technical report to confirm the database shown is the one actually published. Full context for every video — including which models a given database's early JOIN-based pipeline bug did or didn't affect — is on its linked Documentation page.
-
DOI 1.21 New DB
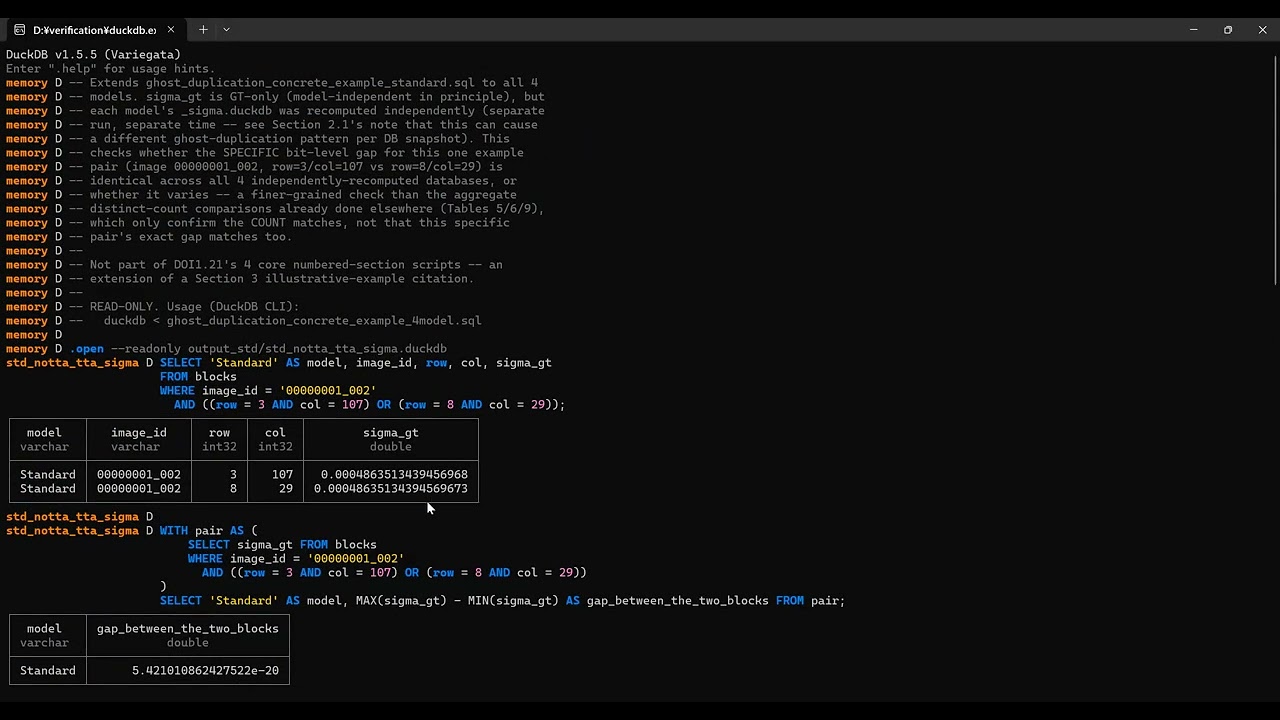
Floating-Point Ghost Duplication, Concrete Example, All Four Models
Two unrelated blocks sharing the same true sigma_gt are found stored with a gap of exactly 2^-64 — the signature of floating-point ghost duplication, not a real difference in content.
-
DOI 1.21 New DB
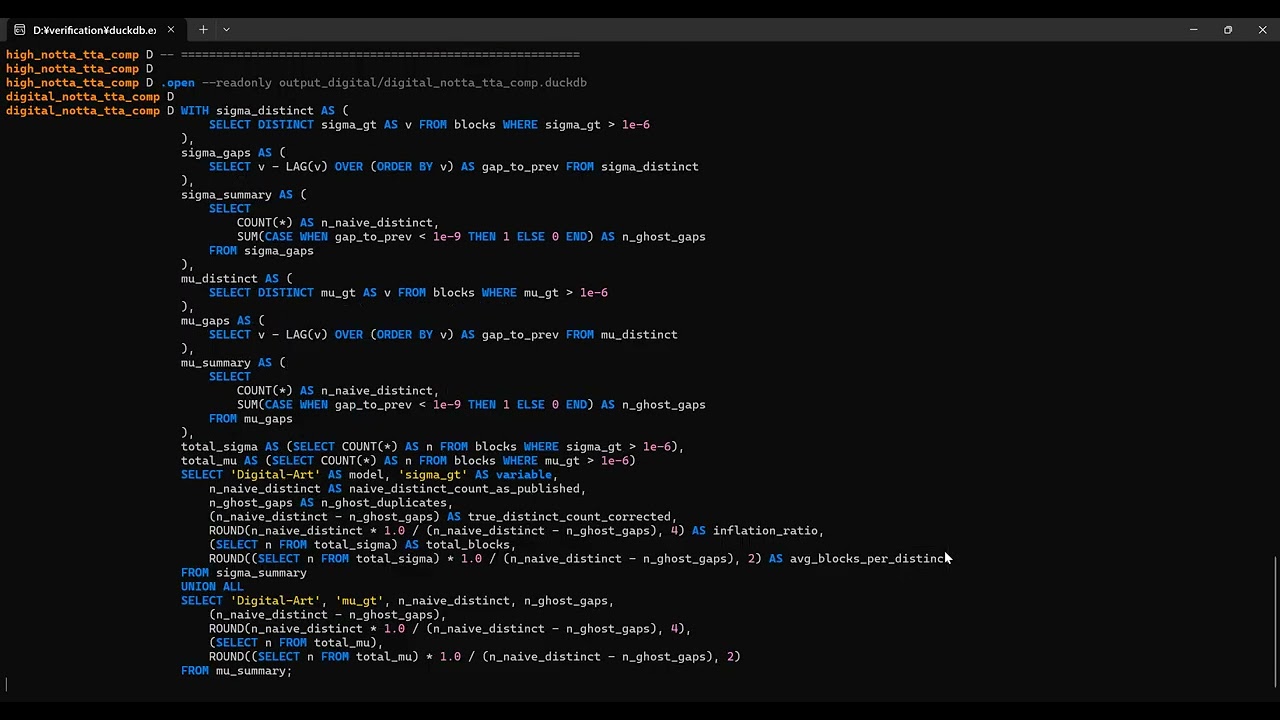
Higher-Precision Distinct-Value Count, All Four Models
Re-running against the exact published database shows sigma_gt's true distinct-value count is 1,184,640, not 2,308,415 — the published figure was 1.95x too high due to floating-point ghost duplication.
-
DOI 1.21 New DB
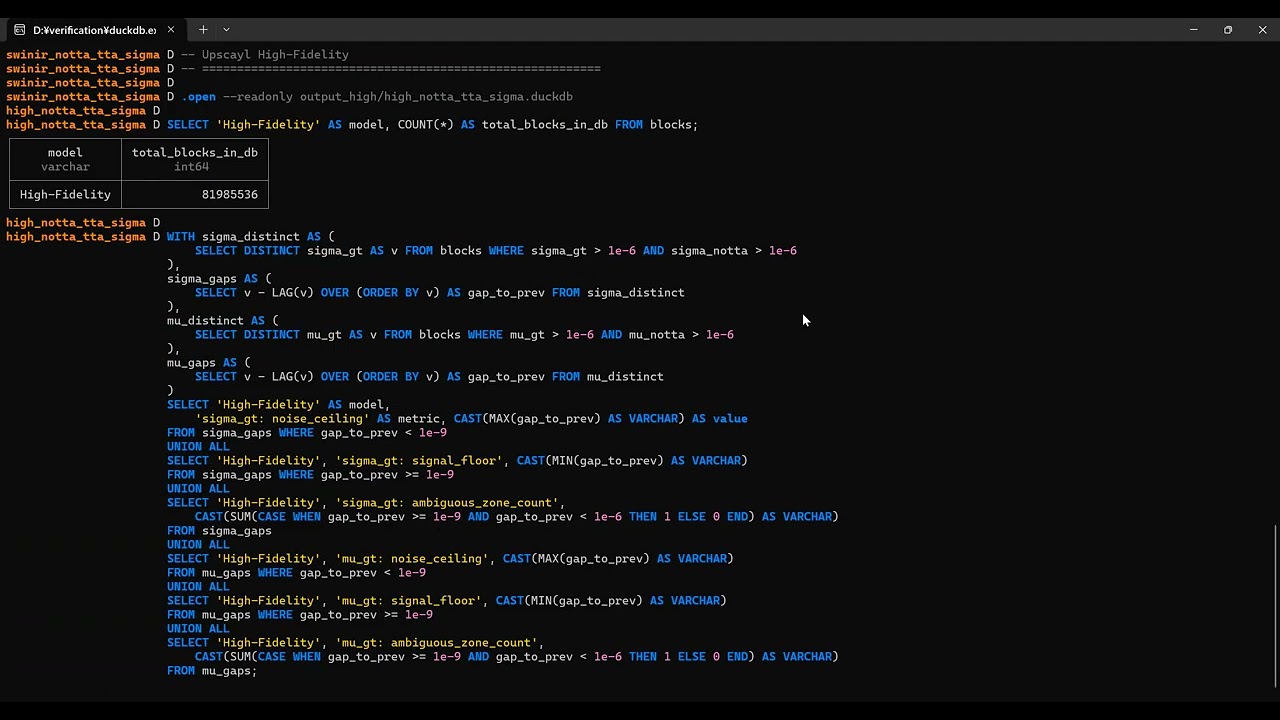
Noise-vs-Signal Gap Threshold Validation, All Four Models
Validates the 1e-9 tolerance threshold used to correct for ghost duplication: a completely empty band, spanning roughly seven orders of magnitude, separates floating-point noise from genuinely distinct values.
-
DOI 1.20.1 New DB
GT-Free Structural Masking Classifier, All Four Models
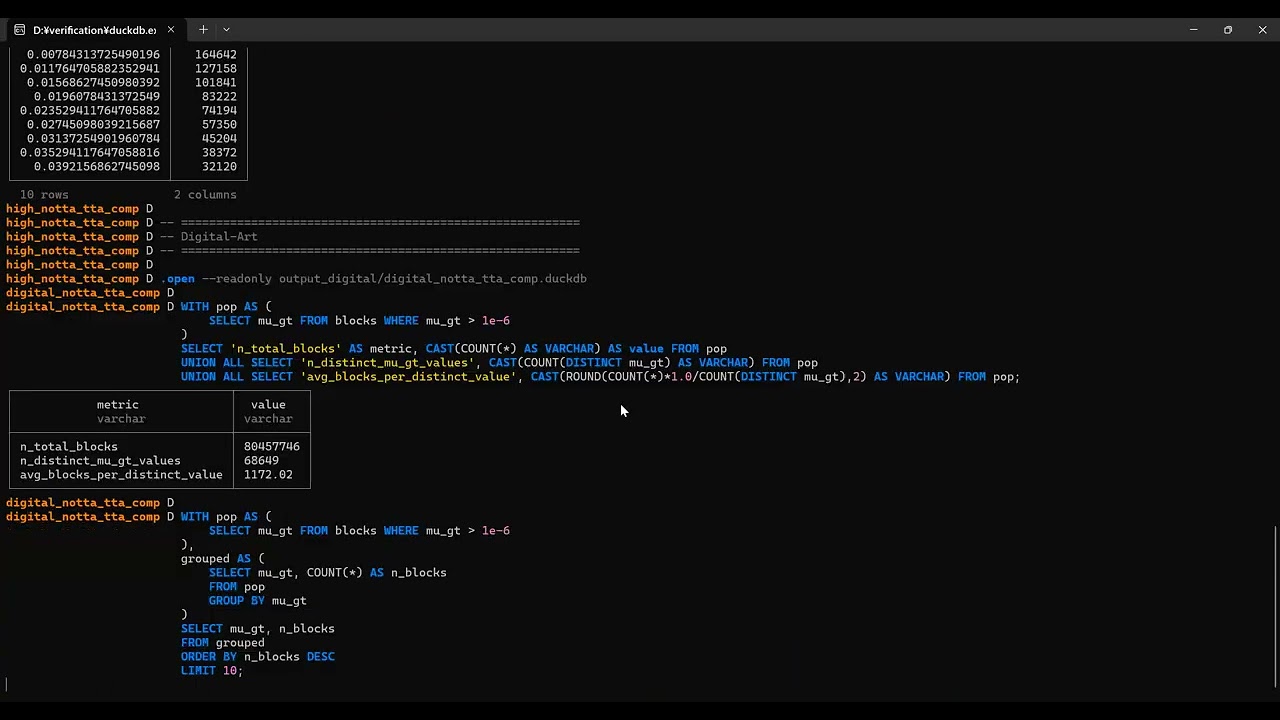
A single untrained threshold, sigma_notta ≤ sigma_stat (sigma_notta measured exactly via comp_contrast_notta/255, not estimated), classifies Structural Masking risk at 98.83–99.53% accuracy across all four models.
-
DOI 1.20 New DB
GT-Free Amplification Phase Classifier, All Four Models
A single untrained threshold, mu_notta ≤ mu_stat (mu_notta recovered algebraically, no ground truth needed at application time), classifies Amplification Phase risk at 96–100% accuracy across all four models.
-
DOI 1.19 New DB
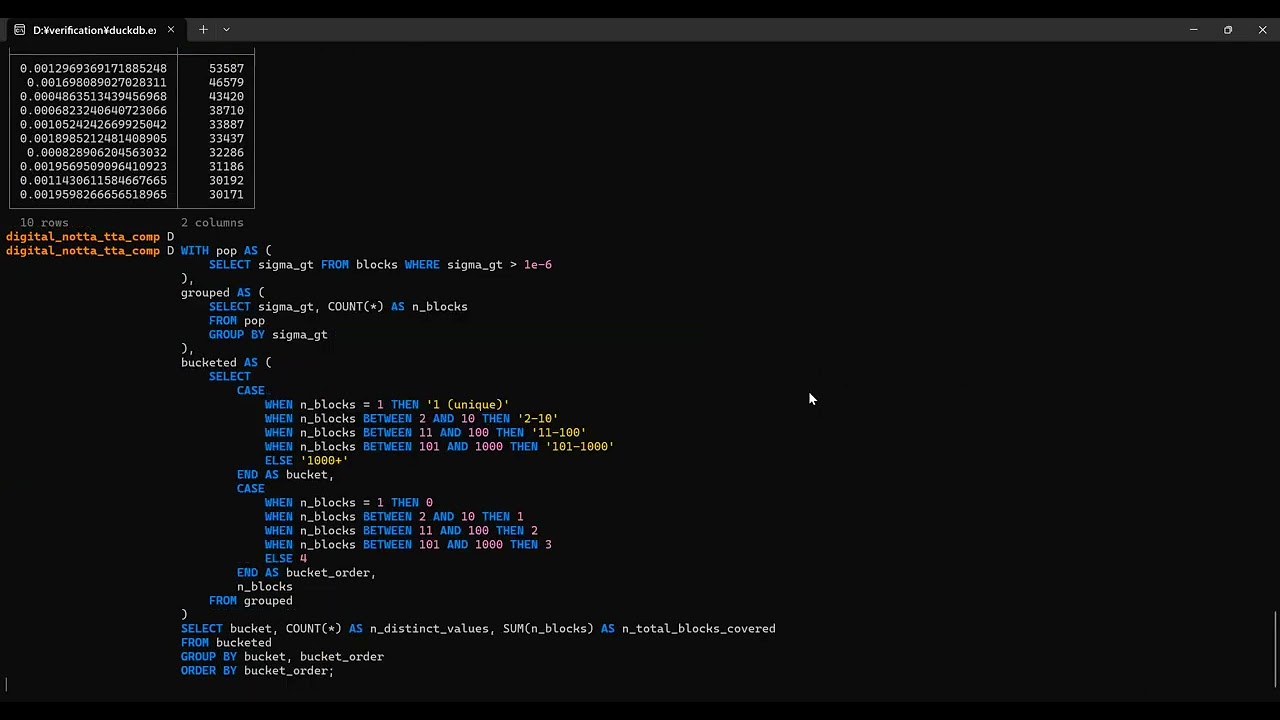
sigma_gt Discreteness, All Four Models
Closes an evidentiary gap in DOI 1.16: proper video-recorded confirmation that sigma_gt's discreteness (2,308,415 distinct values) is byte-for-byte identical across all four models, not just assumed from GT-only dependency.
-
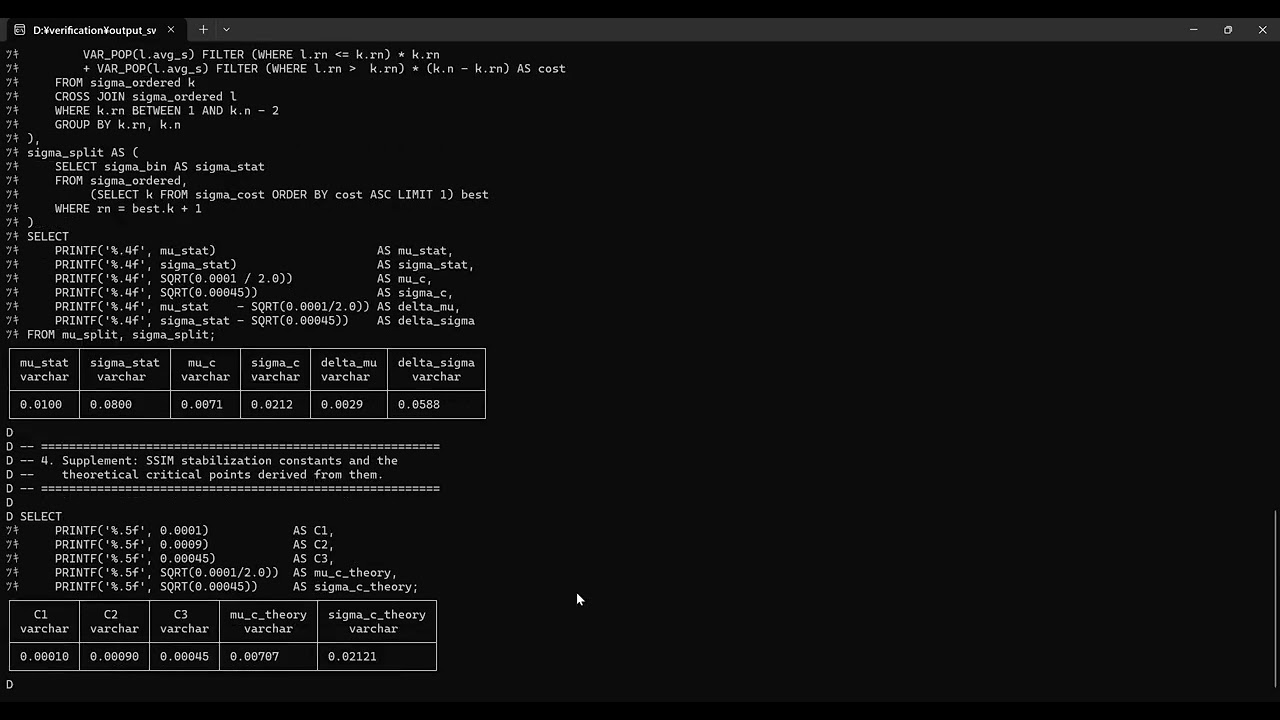
DOI 1.19 New DB
mu_gt Discreteness, All Four Models
Closes an evidentiary gap in DOI 1.18: extends a previously two-model check to a proper video-recorded, four-model confirmation that mu_gt's discreteness (68,649 distinct values) is byte-for-byte identical everywhere.
-
DOI 1.18 New DB
All Four Models
Real nonzero mu_gt=mu_notta ties across all four models (Standard, SwinIR, High-Fidelity, Digital-Art), the luminance-term analogue of DOI 1.16, traced to an even sharper 8-bit pixel quantization.
-
DOI 1.18 New DB
Joint L=C=S=1 Corollary, All Four Models
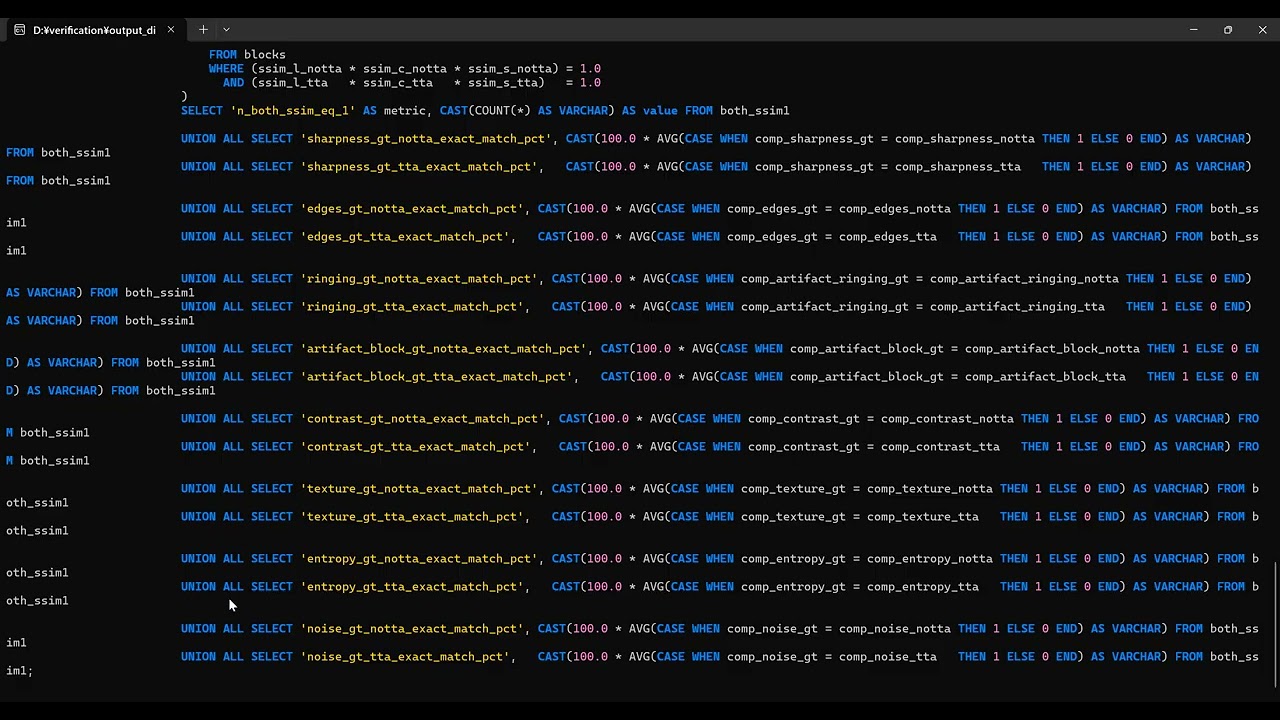
Tests whether SSIM's three sub-terms (L, C, S) can ever coincidentally align to exactly 1 simultaneously for content that isn't pixel-identical — confirmed algebraically impossible, verified against 4,734,946 real blocks.
-
DOI 1.18 New DB
SwinIR Floating-Point Exception Diagnostic
Inspects the 1,442 SwinIR blocks where the product equaled 1.0 without all three terms individually bit-exact — confirmed as machine-epsilon floating-point rounding, not a real exception.
-
DOI 1.16 New DB
All Four Models
Real nonzero sigma_gt=sigma_notta ties across all four models (Standard, SwinIR, High-Fidelity, Digital-Art), traced to 8-bit pixel quantization.
-
DOI 1.15 New DB
All Four Models
Testing the converse of the Pixel Identity Theorem across all four models (Standard, SwinIR, High-Fidelity, Digital-Art), and proving why the contrast term C pins to 1.0.
-
DOI 1.14 New DB
High-Fidelity
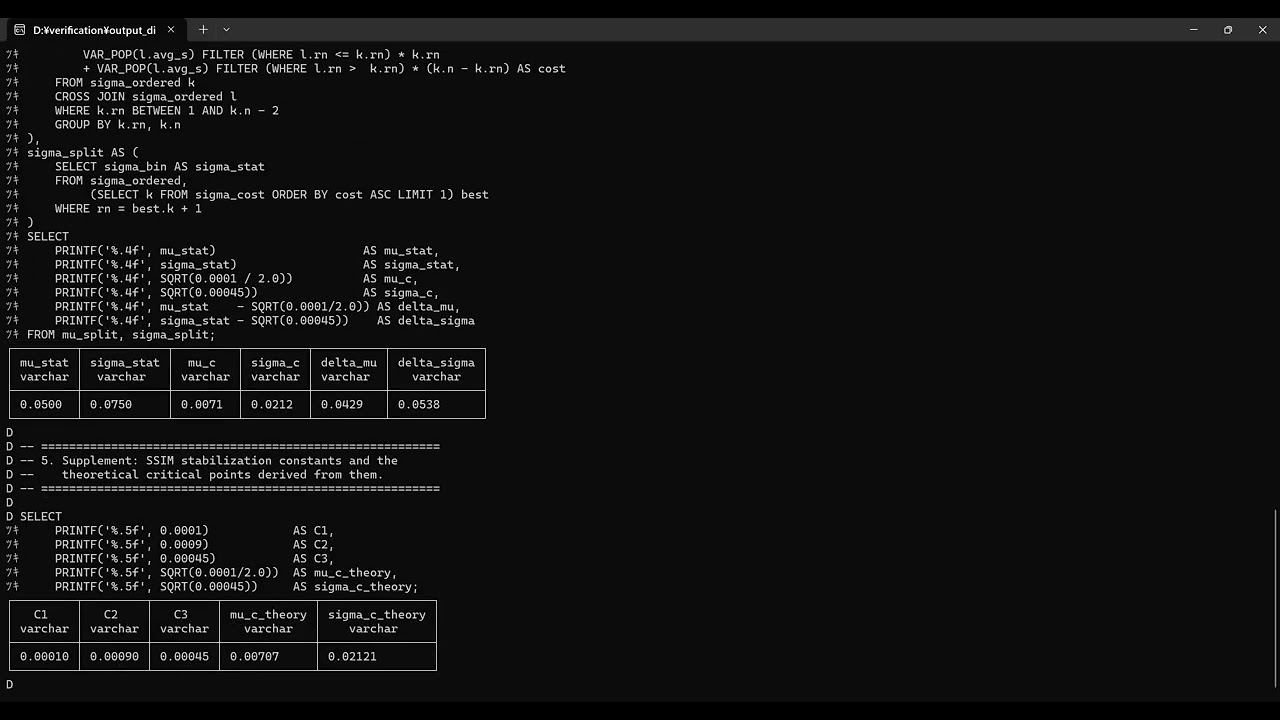
Four-model re-derivation of mu_stat/sigma_stat plus the SSIM=1.0 pixel-identity corollary (High-Fidelity).
-
DOI 1.14 New DB
Digital-Art
Four-model re-derivation of mu_stat/sigma_stat plus the SSIM=1.0 pixel-identity corollary (Digital-Art).
-
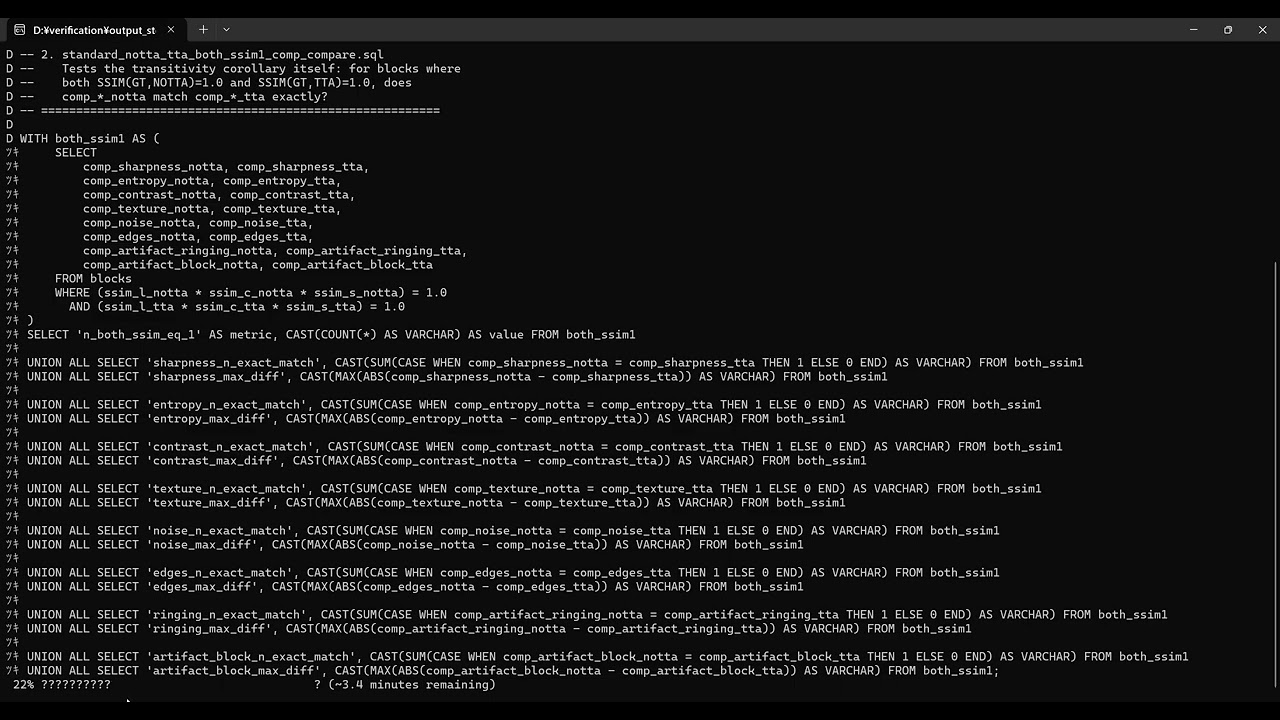
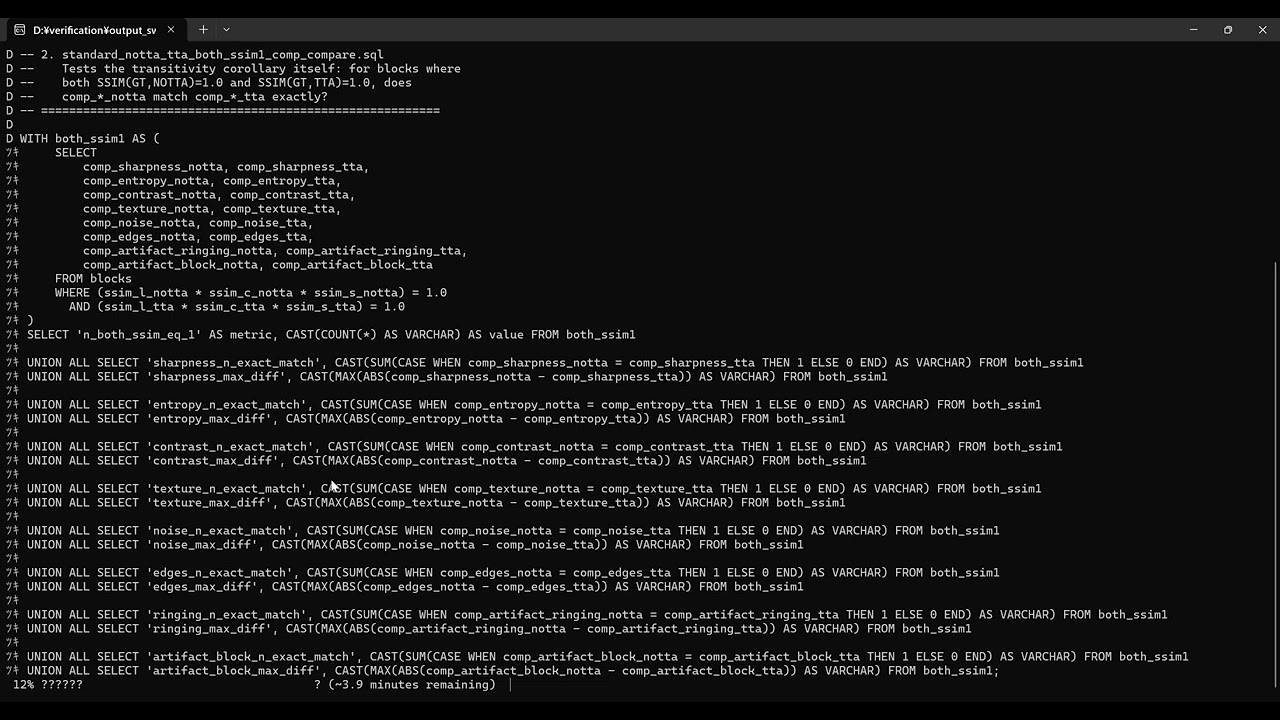
DOI 1.13 New DB
noTTA/TTA Same-Content Check
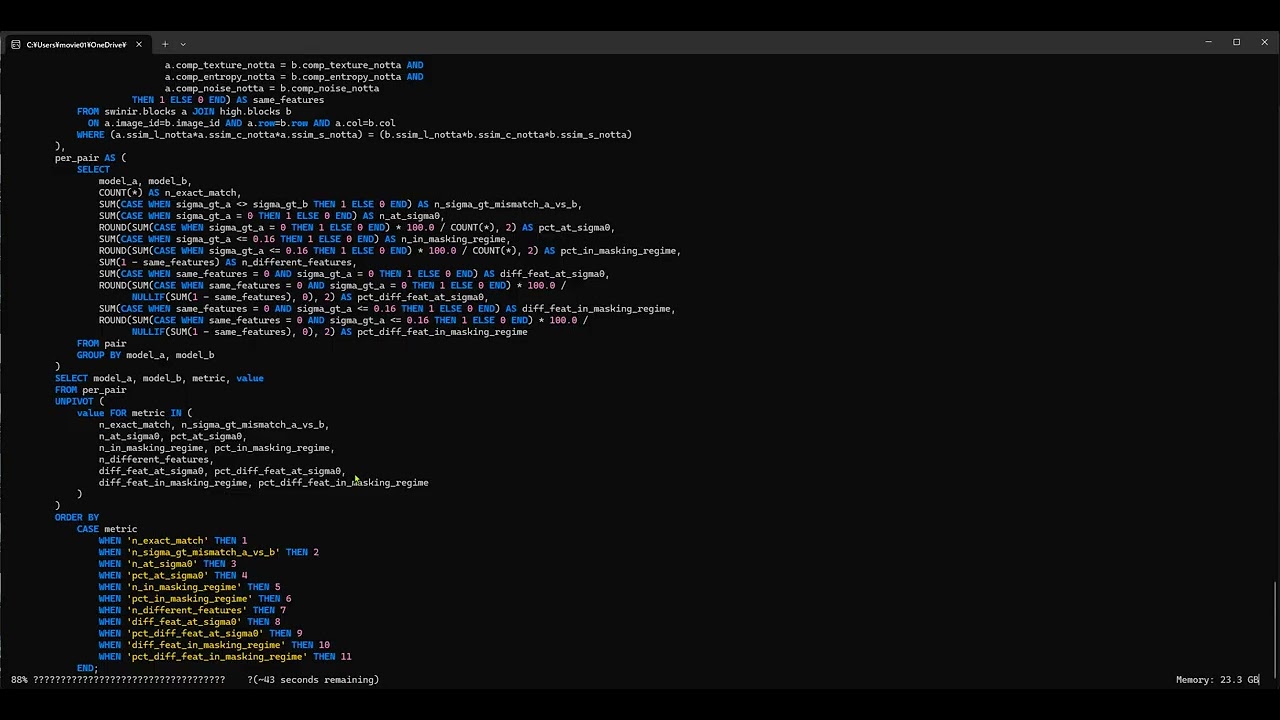
Whether an SSIM tie between a model's noTTA and TTA reconstructions also means the comp_* features agree, across all four models.
-
DOI 1.13 New DB
Cross-Model Same-Content Check
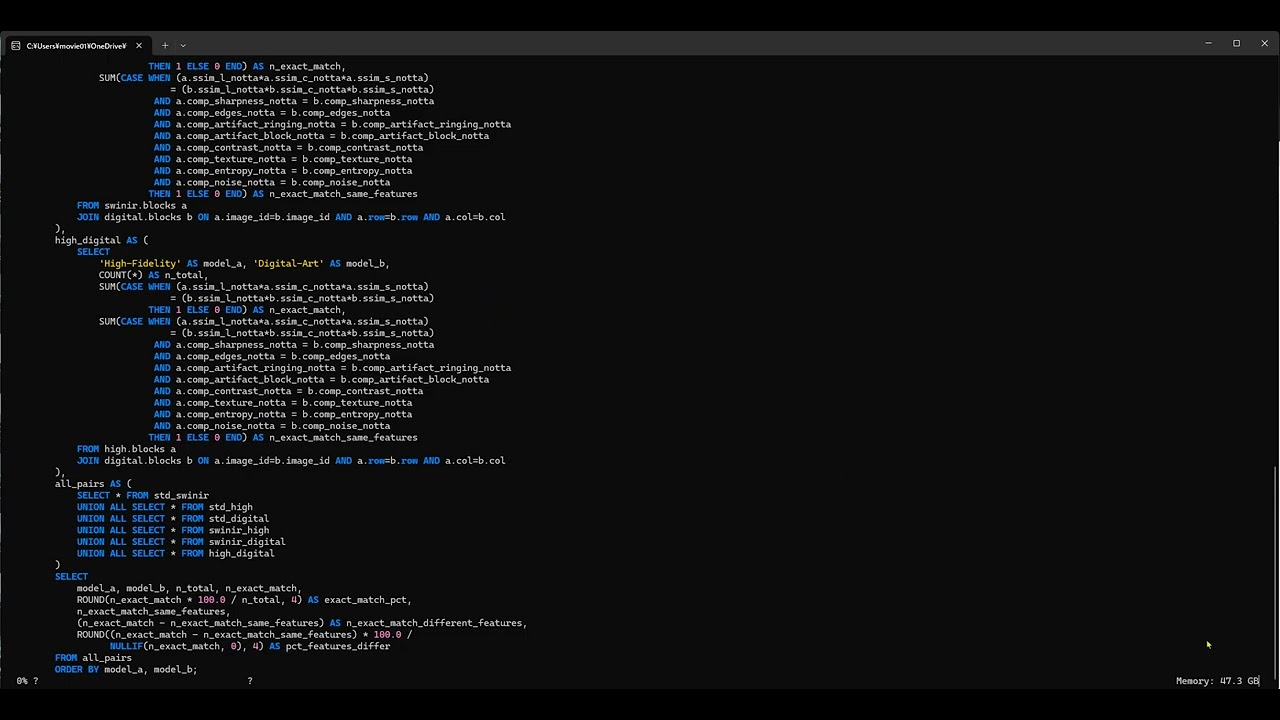
Whether an SSIM tie between two different models' reconstructions also means the comp_* features agree, across all six model pairs.
-
DOI 1.13 New DB
Cross-Model Divergence Mechanism
Why exact cross-model SSIM ties happen at all, and where the residual comp_* disagreement concentrates.
-
DOI 1.12 New DB
Upscayl Standard
sigma_stat correction: the from-scratch re-derivation queries (Standard).
-
DOI 1.12 New DB
SwinIR
sigma_stat correction: the from-scratch re-derivation queries (SwinIR).
-
DOI 1.12.1 New DB
Upscayl Standard
SSIM=1.0 transitivity corollary supplement: the SQL behind DOI 1.12's Pixel Identity Theorem cross-check, previously omitted from that report's bundle. 702,108 blocks, zero exceptions.
-
DOI 1.12.1 New DB
SwinIR
Same transitivity-corollary check, extended to SwinIR to match DOI 1.12's own two-model scope. 2,657,100 blocks, zero exceptions.
-
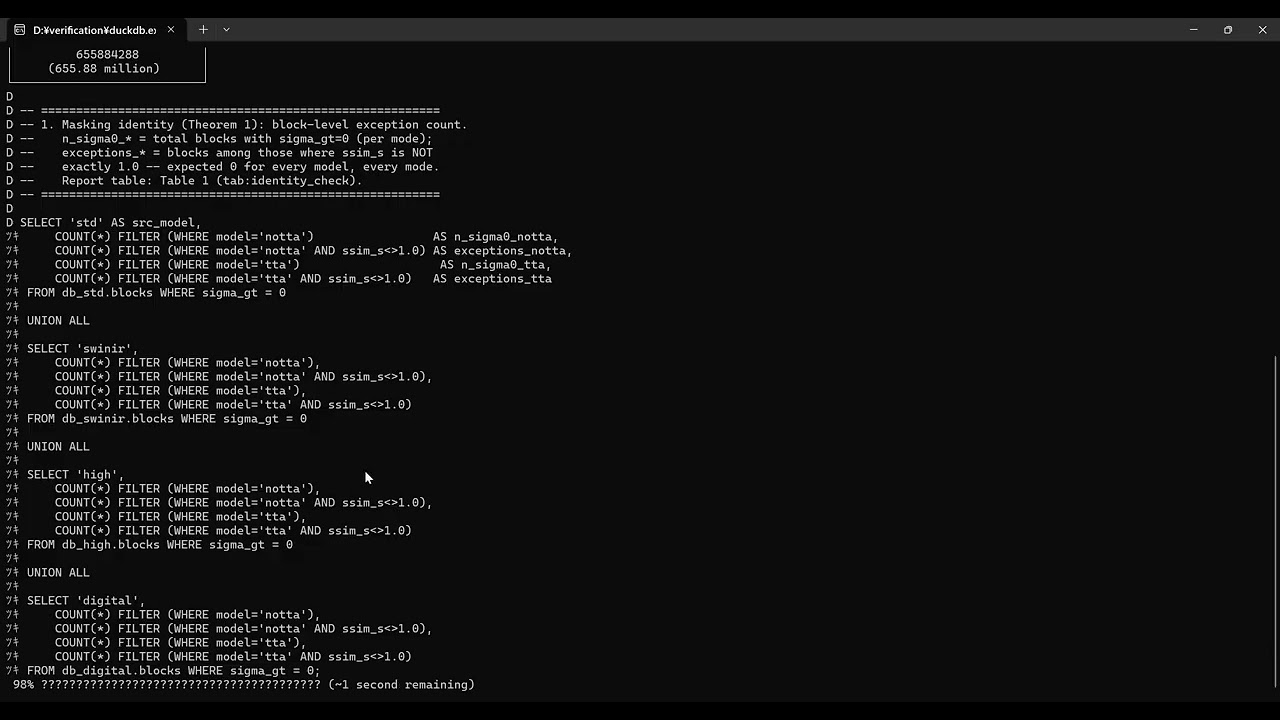
DOI 1.11 Old DB
All Four Models
The masking blind spot theorem, verified across all four models (Standard, SwinIR, High-Fidelity, Digital-Art).
-
DOI 1.10 Old DB
Digital-Art
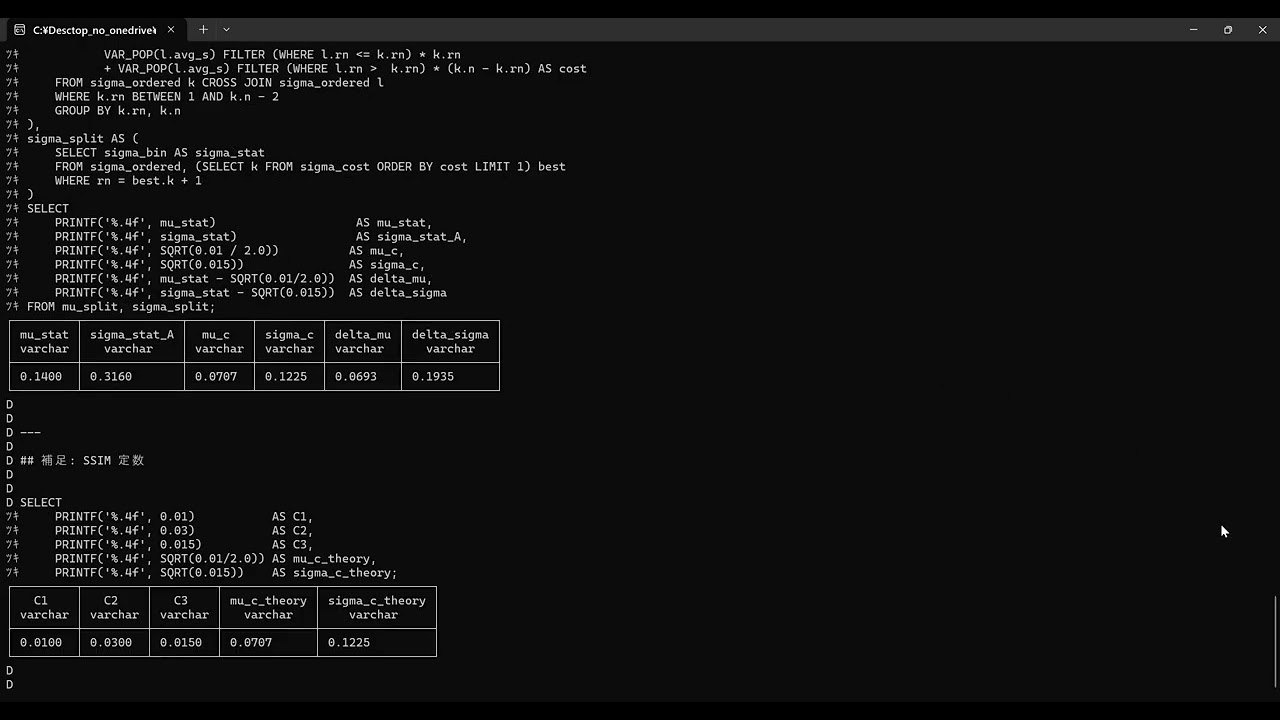
Correction of the C1/C2/C3 constant bug (Digital-Art; verified identically across all four models).
-
DOI 1.9 Old DB
High-Fidelity
Live SQL verification of Failure Fingerprint values (High-Fidelity).
-
DOI 1.9 Old DB
Digital-Art
Live SQL verification of Failure Fingerprint values (Digital-Art).
-
DOI 1.7 Old DB
Digital-Art
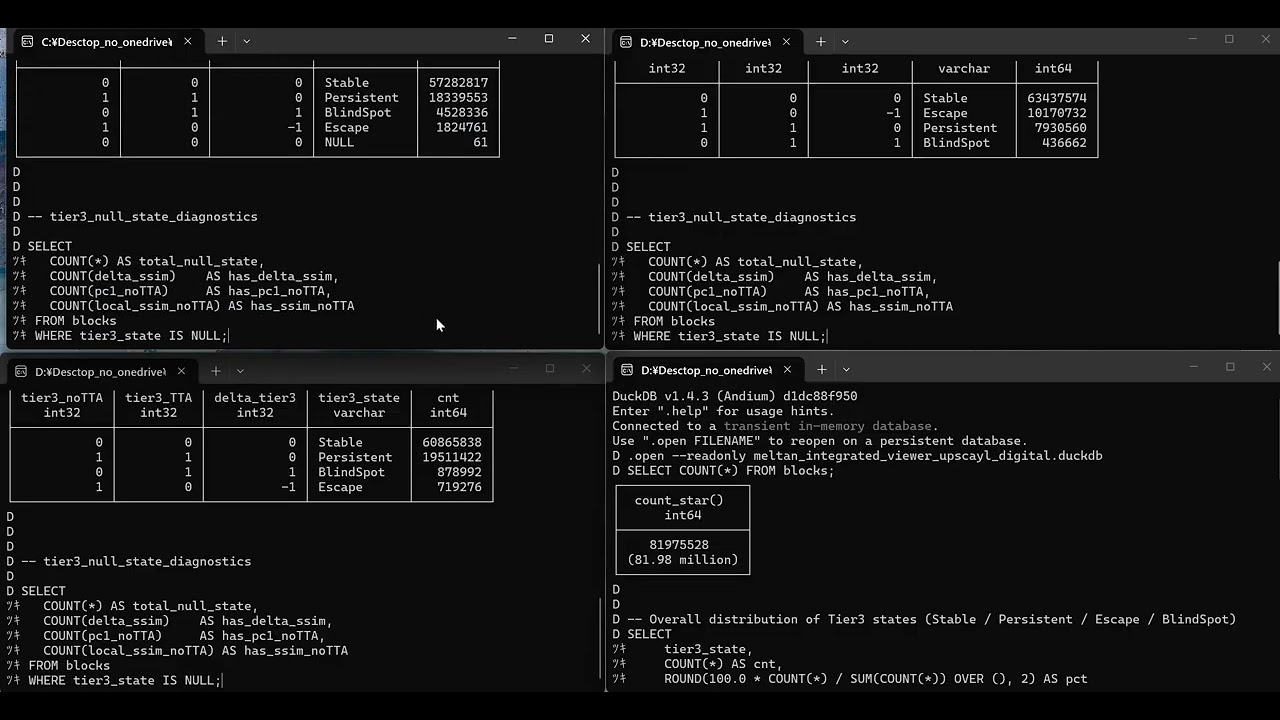
Axis5 collapse intensity and Tier3 state distribution by Axis1 polarity (Digital-Art; verified across all four models).
-
DOI 1.6 Old DB
tier3_v13 (All Four Models)
Tier3 v13 classification coverage across all four models (Standard, SwinIR, High-Fidelity, Digital-Art), with a DOI 1.0–1.6 research overview.
-
DOI 1.6 Old DB
tier3_v14 (SwinIR & High-Fidelity)
Tier3 v14 (corrected) classification coverage for SwinIR and High-Fidelity.
-
DOI 1.5 Old DB
v13 (Original Classification, All Four Models)
Original Tier3 v13 classification and viewer systems, all four models (Standard, SwinIR, High-Fidelity, Digital-Art).
-
DOI 1.5 Old DB
v14 (Corrected Classification, SwinIR & High-Fidelity)
Corrected Tier3 v14 classification, restricted to SwinIR and High-Fidelity (the only two models with sufficient Persistent blocks for this report's comparison).
-
DOI 1.4 Old DB
Eight-Query Walkthrough
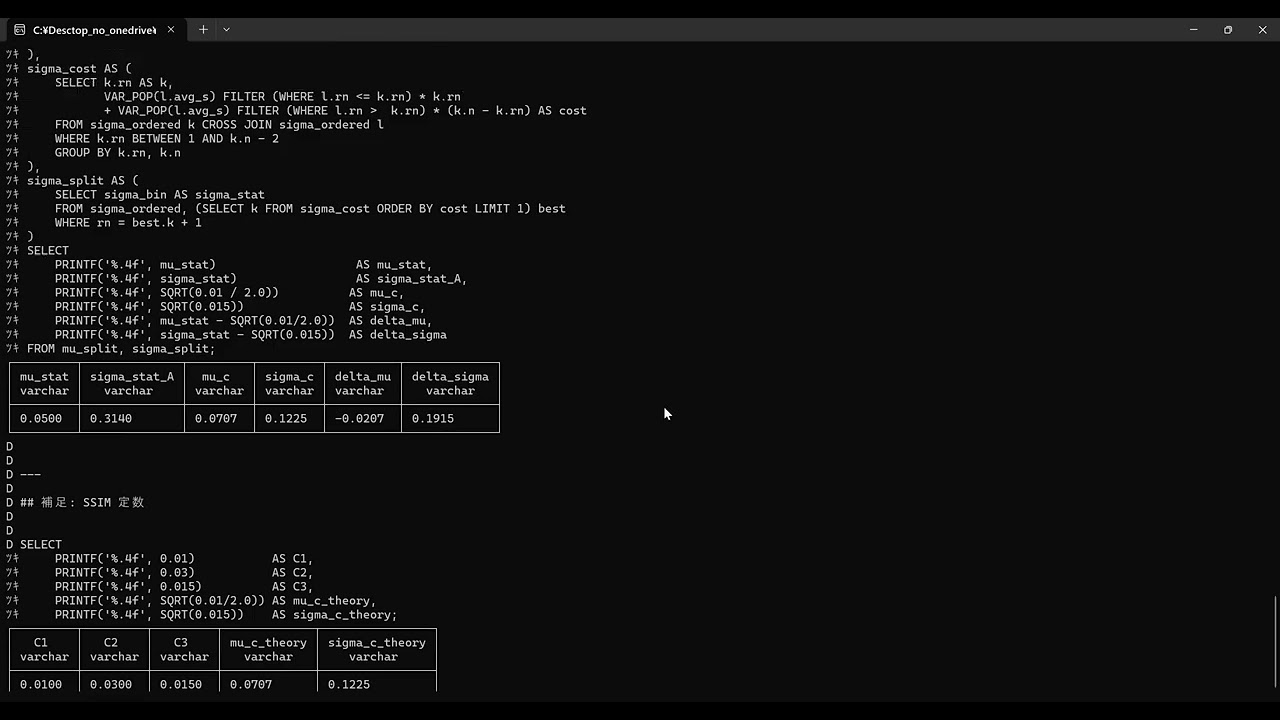
SQL corrections and two sigma_stat approaches (Standard and SwinIR).